


Industry News, Adhesives & Sealants & Tackifiers
2016 Raw Materials and Chemicals Overview
Industry News, Adhesives & Sealants & Tackifiers
The American Chemistry Council’s “Global Chemical Production Regional Index”1 (Global CPRI) shows that the 2016 second quarter ended on a soft note, with the headline index rising only 0.1% on a three-month moving average (3MMA) basis in June. During June, chemical production increased in Western Europe, Central and Eastern Europe, Africa and the Middle East, and the Asia-Pacific regions; production fell in North America and Latin America. The Global CPRI was up 2.1% year-over-year (Y/Y) on a 3MMA basis and stood at 108.5% of its average 2012 levels in June.
During June, capacity usage in the global business of chemistry declined 0.2 percentage points to 79.2%. This is off from 80.7% last June and is below the long-term (1987-2015) average of 89.1%.
Results were mixed on a product basis during June. Weakness in the production of consumer products, organic chemicals, synthetic rubber and other specialties was offset by gains in pharmaceuticals, agricultural chemicals, consumer products, inorganic chemicals, plastic resins, manufactured fibers and coatings. Considering year-over-year comparisons, chemical production increased in most categories with the exception of agricultural chemicals. Growth was strongest in plastic resins, followed by organic chemicals, other specialty chemicals, and consumer products.
| Table 1. Global chemical production by country/region, percentage change (seasonally adjusted, three-month moving overage). | ||||
| Current Month June.16/May.16 |
Prior Month May.16/Apr.16 |
Year/Year June.16/June.16 |
Year-to-Date YTD.16/ytd.15 |
|
| Global Total | 0.1 | 0.1 | 2.1 | 2.4 |
| North America | -0.5 | 0.1 | 1.3 | 1.1 |
| U.S. | -0.5 | 0.1 | 0.7 | 1.0 |
| Canada | -0.4 | 0.1 | 0.7 | 1.1 |
| Mexico | -0.9 | 0.3 | 3.2 | 2.7 |
| Latin America | -0.5 | -0.8 | -1.8 | -0.8 |
| Brazil | -0.8 | -0.2 | -5.6 | -4.9 |
| Other Latin America | -0.2 | -0.4 | -2.4 | -3.6 |
| Western Europe | 0.3 | -0.1 | -8.7 | -6.2 |
| France | -0.3 | -0.2 | 0.7 | 1.8 |
| Germany | 0.3 | -0.7 | 0.1 | 1.6 |
| Italy | 1.0 | 0.0 | -1.0 | -0.2 |
| UK | 0.6 | 0.5 | 1.6 | 1.5 |
| Belgium | 1.3 | 0.4 | 1.4 | -0.3 |
| Netherlands | 1.6 | 0.7 | 3.5 | 3.5 |
| Spain | 0.2 | 0.0 | 4.0 | 4.8 |
| Sweden | 7.1 | 8.5 | 10.6 | -3.9 |
| Switzerland | 0.2 | 0.0 | 0.0 | 0.5 |
| Other Western Europe | 0.1 | 0.2 | -1.0 | 0.2 |
| Central and Eastern Europe | 0.9 | 0.6 | 3.4 | 3.1 |
| Russia | 1.3 | 1.5 | 6.2 | 5.5 |
| Others | 0.6 | -0.4 | 0.8 | 0.8 |
| Africa and Middle East | 0.3 | 1.1 | 6.8 | 6.4 |
| Asia-Pacific | 0.3 | 0.3 | 4.4 | 4.3 |
| China | 0.4 | 0.0 | 6.7 | 6.1 |
| Japan | 0.3 | 0.7 | 3.8 | 3.1 |
| Asia-Pacific (excluding Japan) | 0.4 | 0.1 | 4.6 | 4.6 |
| India | 0.1 | 0.4 | 1.8 | 1.3 |
| Australia | 1.6 | 1.6 | 2.4 | 0.2 |
| South Korea | 0.1 | 0.2 | 3.4 | 3.1 |
| Singapore | -0.1 | -0.2 | -2.7 | 1.4 |
| Taiwan | 1.5 | 1.5 | -0.9 | 1.2 |
| Others | 0.0 | -1.1 | 3.7 | 6.3 |
Source: The American Chemistry Council.
U.S. demand for solvents is forecast to rise 1.1% per year through 2020, to 9.6 billion lbs, reflecting continued economic growth and, in particular, ongoing healthy increases in construction activity. According to a recent study from The Freedonia Group Inc., strength in both residential and nonresidential building construction will stimulate demand for related materials, such as adhesives, sealants, and coatings.2
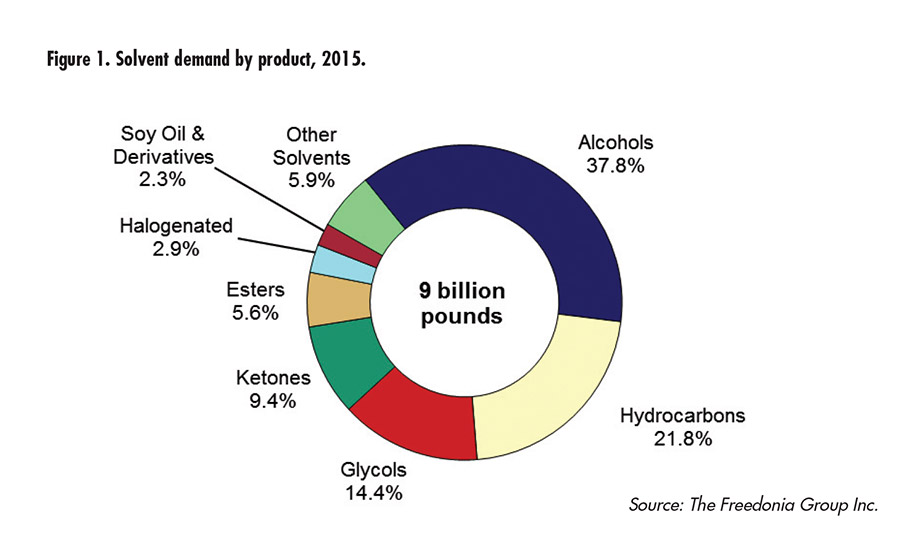
Figure 1. Solvent demand by product, 2015
Environmental regulations will continue to drive a shift toward less hazardous solvents with reduced emissions and lower toxicity (see Figure 1). Public perception and consumer preference will also favor green products derived from renewable resources such as plant-based alcohols, soy methyl ester, and terpenes. Changes in the oil and natural gas industry will also impact demand, with reduced drilling rates in the near term holding back solvent consumption, and relatively low crude oil and natural gas prices providing a more competitive position for conventional solvents.
Demand for green solvents that avoid any of a number of potential environmental pitfalls are expected to advance at an above-average pace, offering growth opportunities in many otherwise mature applications. In particular, green solvent demand will outpace conventional solvent demand in food production, chemical processing, cosmetics and toiletries, cleaning products, and printing inks. In many cases, solvent users will turn to products with lower emissions or better toxicity profiles to address tightening volatile organic compound (VOC) and hazardous air pollutant regulations.
Beyond the greater use of biodegradable green solvents, the rapid expansion of U.S. petroleum and natural gas production from 2010 to 2015 also helped drive solvent demand overall. Though solvent consumption in the oil and gas market was impacted in 2015 by the sharp decline in crude oil prices, which in turn caused the industry to significantly curtail well drilling and completion activity, a recovery is expected to begin by 2020 as global oil supply and demand rebalance, and prices begin to recover. Rising crude oil and natural gas prices will also impact the competitiveness of conventional solvents, which had benefited from a better cost position compared to green solvents.
| Table 2. Global chemical production by segment, percentage change (seasonally adjusted, three-month moving average). | ||||
| Current Month June.16/May.16 |
Prior Month May.16/Apr.16 |
Year/Year June.16/June.15 |
Year-to-Date YTD.16/YTD.15 |
|
| Global total | 0.1 | 0.1 | 2.1 | 2.4 |
| Pharmaceuticals | 0.3 | -0.1 | 0.5 | 1.5 |
| Chemicals (excluding Pharma) | 0.0 | 0.1 | 2.5 | 2.6 |
| Agricultural chemicals | 0.2 | -0.2 | -0.9 | -0.5 |
| Consumer products | -0.6 | -0.4 | 2.0 | 2.2 |
| Basic chemicals | 0.0 | 0.4 | 2.7 | 3.1 |
| Inorganic chemicals | 0.3 | 0.6 | 0.6 | -0.4 |
| Organic chemicals | -0.3 | -0.5 | 3.2 | 3.2 |
| Plastic resins | 0.1 | 0.9 | 4.0 | 5.0 |
| Synthetic rubber | -0.5 | 0.1 | 0.2 | 1.2 |
| Manufactured fibers | 0.9 | 2.4 | 1.0 | 2.7 |
| Specialty chemicals | 0.0 | 0.0 | 2.7 | 2.5 |
| Coatings | 0.2 | 0.0 | 1.7 | 1.2 |
| Other specialty chemicals | -0.2 | 0.1 | 3.1 | 2.9 |
Source: The American Chemistry Council.
The global market size of coating additives is projected to reach $9.19 billion by 2021, registering a CAGR of 6.1% between 2016 and 2021, according to a recent report from Markets and Markets.3 The growing construction industry is expected to drive the coating additives market during the forecast period. China, Korea, Japan and India are seeing high demand for high-quality construction materials. In addition, the growing automotive sector in these countries is fueling the demand for coating additives.
Waterborne formulation is expected to be at the forefront of the coating additives market. Stringent environmental regulations in North America and Europe will drive the demand for waterborne formulations in architectural application, due to presence of non-hazardous chemicals. With the tightening of regulations over VOC content, formulators are forced to either use additives that help in reducing the VOC content or shift to waterborne formulation. However, solventborne formulation is also expected to show moderate growth rate due to its use in the Asia-Pacific region, which has less stringent environmental regulations.
The major applications for coating additives are architectural, automotive, industrial, and wood and furniture. Architectural applications accounted for the largest share of the coating additives market. The growing worldwide construction sector will drive the demand for coating additives, which are widely used in paints and coatings for protection of various materials under extreme conditions. The ability of the additives to provide protection from moisture, microbial growth, heat, and chemical factors makes it ideal for protection. Coating additives are extensively used in formulations for underground pipes, civil engineering projects, towers, offshore structures, and chemical industries. The heat-resistant property of some coating additives makes them important in electrical and electronic applications; its use in these applications is expected to increase in the future.
The coating additives market is broadly segmented into five regions; Asia-Pacific, North America, Europe, the Middle East and Africa, and South America. Asia-Pacific is expected to dominate the coating additives market during the forecast period. The major contributor to the region’s growth is the fast-growing economies in countries such as China, India, Japan, and South Korea.
The ultraviolet (UV)-curable resins market size was estimated to be worth over $3.5 billion in 2015 and is expected to exceed $8.6 billion by 2023, growing at a CAGR of more than 9.2% from 2016 to 2023, according to a study from Global Market Insights Inc.4
China’s UV-curable resins market dominated Asia-Pacific demand and accounted for more than 51% of consumption in 2015, followed by Japan, with 25%. Rapid industrialization and manufacturing sector growth were among the key factors to drive demand in the region.
North America is expected to grow at a significant rate due to the increasing trend for green technology and growth in the processed food industry. Europe is predicted to witness moderate growth; coatings and inks are likely to be key applications to drive demand in the region.
Increases in construction spending, coupled with the need to build sustainable infrastructures, are likely to positively influence the Middle East and Africa UV curable-resins market. Saudi Arabia dominated regional construction spending at more than $1 trillion in 2015.
UV-curable resins are gaining popularity in various industries due to their emission-free and high-performance properties. This is an emerging technology that is used to cause photo-polymerization in a range of products, such as adhesives, coatings, and inks. Global demand is likely to rise due to the increasing needs from various end-user industries, including graphic arts, industrial coatings and electronics.
Fillers are more than just cheap filling materials; they can also improve characteristics such as stability, weather resistance, and electrical conductivity in many products. In a recent report, Ceresana predicts that global revenues generated with fillers will increase until 2023 to $31.76 billion.5 Thus, fillers are economically the most important class of raw materials.
Fillers are mainly used in adhesives and sealants, paper, plastics, paints and varnishes, and elastomers. While applications in the paper industry account for a market share of 33% in Western Europe, the share is below 20% in Asia.Conversely, manufacturers of elastomer products in Asia hold a share of over 32% on the filler market; in Western Europe, the share amounts to 21%. Asia-Pacific accounted for around 48% of global demand for fillers in 2015. Due to above-average growth rates, demand in this region is predicted to rise to just below
39 million tons. The second-largest market for fillers is Western Europe.
With a market share of 34%, the most commonly used filler on the global market is ground calcium carbonate (GCC), followed by precipitated calcium carbonate (PCC). Until 2023, GCC’s market share is expected to increase 2.7% per year.
Carbon black is not only used as a pigment; it is the third-largest filler market worldwide, with a demand of 11.4 million tons. The rubber and elastomer industry uses carbon black as reinforcing filler, mainly to improve abrasion resistance of tire rubber. The second-largest application area of carbon black as a filler are elastomer products for industry and construction; this sector consumes around 1.3 million tons.
1. “Global Chemical Production Regional Index,” (published July 2016), American Chemistry Council, https://www.americanchemistry.com/Media/PressReleasesTranscripts/ACC-news-releases/Global-Chemicals-Production-Ends-Second-Quarter-on-Soft-Note.html.
2. “Solvents,” (published July 2016), The Freedonia Group, www.freedoniagroup.com.
3. “Coating Additives Market by Function (Rheology Modifiers, Dispersing, Wetting Agent, Impact Modifier, Anti-Foaming), Application (Automotive, Architecture, Industrial), Formulation (Water, Solvent, Powder Based), and Types – Global Trends & Forecasts to 2021,” (published July 2016), Markets and Markets, http://www.marketsandmarkets.com/Market-Reports/coating-additives-market-1268.html.
4. “Ultraviolet (UV) Curable Resins Market Size, Industry Analysis Report, Regional Outlook, Application Development Potential, Price Trend, Competitive Market Share & Forecast, 2016–2023,” Global Market Insights Inc., https://www.gminsights.com/industry-analysis/ultraviolet-uv-curable-resins-market.
5. “Market Study: Fillers,” Ceresana, www.ceresana.com/en/market-studies/additives/fillers.