

Industry News, Coatings
Coatings Industry Continues to Evolve
Industry News, Coatings
Link: Market Trends: Coatings Industry Continues to Evolve | ASI
By: KNG, a market researcher for the polymer and chemical industries since 1995.
Kusumgar, Nerlfi & Growney recently announced it has begun its fifth “U.S. Paint & Coatings Industry” study. The industry is reportedly continuing its recovery from the global recession of 2008-2009. Consumption is projected to be 8.8 billion dry lbs (excluding water and solvent) in 2015, valued at some $28 billion. Despite being, a mature industry, coatings continue to evolve to meet the challenges of regulations, growing consumer demands, increased emphasis on sustainable products, globalization, cost pressures, etc. The recent sharp drop in oil prices could force coatings prices lower if continued.
Architectural coatings are projected to capture just over one-half of the volume in 2015. While volume is still somewhat below the peak level of 2006, it has grown modestly in recent years. Pricing is up as material costs have increased and products have become more sophisticated.
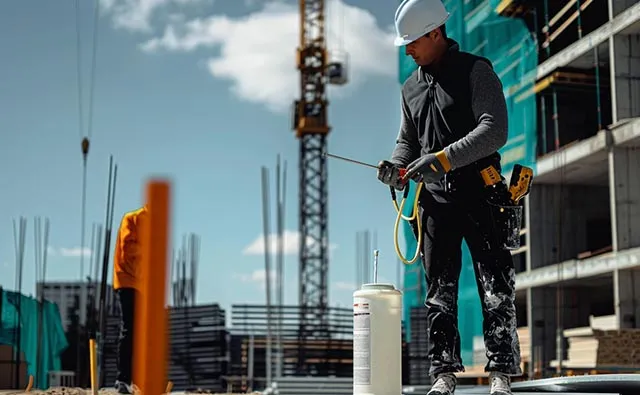
Original equipment manufacturer (OEM) coatings are forecast to take one-quarter of the volume in 2015. OEM coating growth varies among the end uses with automotive and aerospace growing strongly in recent years. Special-purpose coatings are expected to be 24% of the 2015 volume. Industrial maintenance and specialty roof coatings are end uses that have grown with the economic recovery and increased construction spending.
| Technology | 1996 | 2001 | 2006 | 2011 | 2015 (est.) |
| Water-based (%, Total) | 3,640 (48%) | 4,164 (51%) | 5,193 (55%) | 4,369 (56%) | 5,165 (58%) |
| —Architectural | 2,769 | 3,029 | 3,750 | 3,058 | 3,720 |
| —Industrial | 871 | 1,135 | 1,443 | 1,311 | 1,445 |
| %, Industrial | 24% | 27% | 28% | 30% | 28% |
| Solvent-based (%, Total) | 3,137(42%) | 3,063 (37%) | 3,298 (48%) | 2,605 (33%) | 2,650 (30%) |
| —Architectural | 874 | 904 | 1,170 | 818 | 780 |
| —Industrial | 2,263 | 2,159 | 2,128 | 1,787 | 1,870 |
| %, Industrial | 72% | 70% | 65% | 59% | 71% |
| Powder (%, Total) | 292 (4%) | 436 (5%) | 477 (5%) | 401 (5%) | 460 (5%) |
| Other 100% solid liquids (%, Total) | 405 (5%) | 435 (5%) | 445 (5%) | 340 (4%) | 400 (4%) |
| Radcure (%, Total) | 54 (0.7%) | 86 (0.1%) | 102 (0.1%) | 91 (0.1%) | 125 (0.1%) |
| Total (rounded) | 7,530 | 8,180 | 9,515 | 7,805 | 8,800 |
| %, Charge | – | +8.6% | +16.3% | -18.0% | +12.7% |
Table 1 shows historical coating consumption in dry pounds by technology. Water-based (WB) technology is forecast to be 58% of the volume in 2015, up from a 48% share in 1996. Architectural paints are 71% of the WB pounds, and industrial coatings, which includes both OEM and special purpose, represent 29%. Solvent-based technology is projected to capture 30% of the 2015 volume, which is down from a 42% share in 1996. Just over 70% of solvent-based coating in 2015 will be used in industrial applications.
Powder, radcure and other 100% solids technologies are nearly exclusively confined to the industrial coatings segment. They are projected to garner 11% of the coating volume in 2015. These technologies represent roughly 40% of the OEM volume and 5% of special-purpose coatings. Powder has grown from 14% of the OEM coating volume in 1996 to just over a 20% share in 2015.
Copyright of this article by ASI. We are sharing and promoting the market innovation.
If you like this article, kindly to visit www.adhesivesmag.com